As a professional in the financial world, you must keep an eye on market trends and price changes to make successful decisions. This is especially vital for Forex or crypto traders who need to be up-to-date with current market movements, as these markets can be volatile and sometimes totally unpredictable.
Financial markets are dynamic and move rapidly. Traders have discovered that using visual representations such as charts and graphs makes understanding and forecasting the markets much simpler. This process of visualization allows us to identify trends, remember repeating patterns in data quickly, and craft reliable predictions with ease.
Candlesticks are unequivocally acknowledged as the clearest and simplest charts in Forex trading, so let’s explore what they are and how they can be of help to you.
What are Candlestick Patterns and Why Do They Matter?
Candlestick charting techniques can be traced back to Japan in the 1700s when a man named Homma discovered that the prices of rice were related not only to supply and demand but also to the sentiment of those who traded it. This discovery predates the development of bar and point-and-figure charts in the West, making it one of the earliest forms of charting. Candlestick charts continue to be used today and are an important tool for analyzing market movements.
Eye-catching candlesticks effectively illustrate price fluctuations. Skilled traders today utilize these candles to make decisions based on underpinning patterns that assist them in predicting near-term market direction.
Candlestick charts are superior to OHLC bars and line graphs in their capacity to condense a vast array of data points into one single bar.
Candlesticks are a helpful tool for traders who want to view the complete picture of one trading day at once. This type of representation can be especially useful for those focused on a swing or long-term strategies.
Candlestick Patterns’ Interpretation
Every pricing candle consists of three major price points: open, close, and wicks. These points specify where an asset’s cost opens and closes during a given period which ultimately creates its body.
On the chart, price data as candle stick representations may vary depending on your preferred time frame. For a daily chart, for instance, each candle will demonstrate the opening and closing prices of that particular day, along with its highest and lowest points.

When a new candle starts, the initial trade is termed the open price. If the stock prices ascend, then the candle will be painted either green or blue; conversely, if it drops down in value, it turns red.
When the candle formation process is complete, the closing price is seen. If it’s lower than the opening value, then the candle’s color will be red; alternatively, if it surpasses the open price, then you’ll likely see that reflection as green or blue coloring on your graph.
Every candlestick has a “shadow,” or wick, to accurately delineate maximum and minimum values during certain periods of time. These shadows are easily distinguished from the rest of the candle’s body since they appear much thinner than the body.
The top point of wicks/shadows shows the highest prices throughout the whole time period, and the lowest points show their lowest prices.
With the candlestick’s hue depicting price movement, green or blue candles show an increase in value from when it opened — signaling gains. On the other hand, a red candle demonstrates that prices have dropped since the market opening, indicating negative growth and losses.
The price range of a candle is determined by subtracting the lower wick from its upper wick. This will help you identify what your candle’s highest and lowest selling prices were.
Knowing the points and characteristics of a candlestick chart can be very beneficial to traders.
Useful Candlestick Patterns
To date, 42 various candlestick patterns have been classified. They are separated into two categories: basic and complex. Now let us dive into some of the most frequently encountered patterns that traders come across in their trading journeys.
Doji and Spinning Top
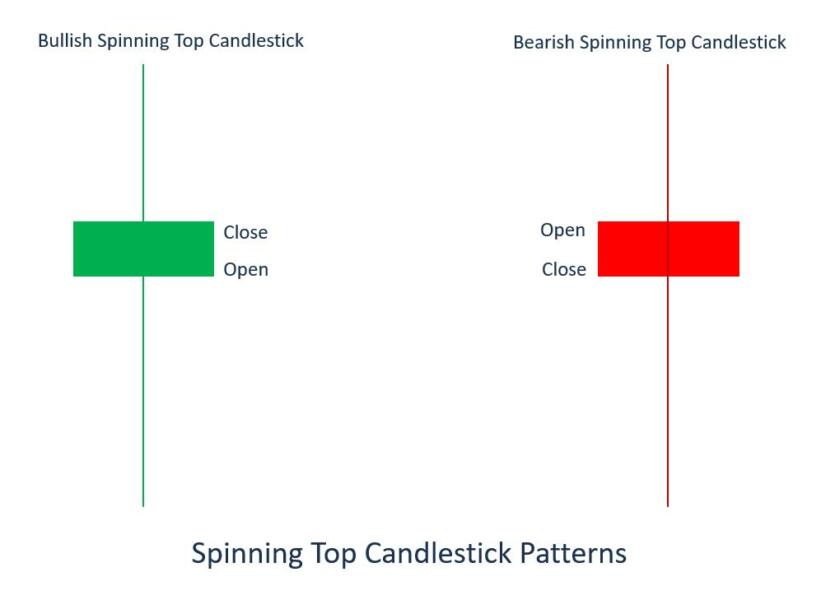
A Doji is a candlestick figure in which the opening and closing prices are effectively identical. Its close cousin, the spinning top candle formation, also has nearly the same opened and closed position; however, unlike the Doji candle, it has a tiny visible body.
Evidently, if you see such a candle, it means the market is exhibiting hesitation as buyers and sellers are unable to come to a consensus. However, this pause in activity also indicates that the market won’t be long before it breaks the stalemate and creates a new price trend.

Hammer
A hammer illustrates the conclusion of a downturn (hammering out a bottom). The long lower shadow insinuates that sellers once again attempted to drive down the value; however, they were turned away, and as such, the price recovered its losses.

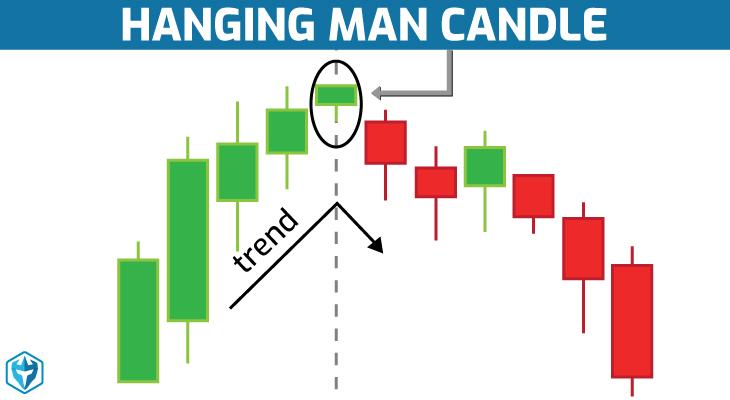
Hanging Man
The hanging man pattern is a bearish reversal formation and the opposite of a bullish hammer. It suggests that selling pressure has overwhelmed buying interest, resulting in an extended shadow pointing downward. The confirmation comes in the form of the following red candle, indicating a potential short signal. This could be an important warning sign to investors about a possible downside trend.

Bearish/Bullish Engulfing
As sentiment abruptly turns bearish, a classic chart pattern known as the bearish engulfing appears. This visual is represented by a large red candle devouring an insignificant green one — signaling that buyers have lost control and prices may soon be in decline.

With an “engulfing pattern” on the bullish side of the market, buyers are overpowering sellers; demonstrated by a lengthy green real body that completely engulfs a small red real body. This suggests that bulls have completed their takeover, and it is likely for asset prices to increase.
Conclusion
Candlestick charts are an incredibly powerful asset for traders and investors to study market data. By reviewing price movements over a particular period of time, these visuals offer traders a reliable way to analyze the current state of the markets and can even predict future developments. Knowing how to read basic Candlestick patterns is essential in order to reap maximum rewards from trading the market.
Also read: The Best Price Tracking Tools for Comparisons and Price Alerts


